- Код статьи
- S032150750000091-2-1
- DOI
- 10.31857/S032150750000091-2
- Тип публикации
- Статья
- Статус публикации
- Опубликовано
- Авторы
- Том/ Выпуск
- Том / Выпуск №7
- Страницы
- 2-9
- Аннотация
This paper, which is based on a series of author’s calculations and models, analyzes major trends, proportions and economic and social determinants and consequences of Least Developed Countries’ (LDCs’) economic growth during the last three to four decades. It is argued that despite gargantuan problems that LDCs are facing, a few dozens of them have recently started to progress on the path of rather fast and more or less sustained economic growth. Although LDCs are still grappling with severe forms of multidimensional poverty, substantial dearth of human capital and modern infrastructure, adequate economic, social, political and legal institutions, and encounter considerable foreign economic and climatic shocks, they on average during the last decade and a half managed to have markedly increased their rates of growth of per capita GDP and human development index. It should be underscored that LDCs having benefitted from significant improvement of barter terms of foreign trade, some upgrade in government effectiveness and implementation of a series of pragmatic economic reforms, have succeeded in expanding rates of growth of agricultural and manufacturing production and exports. The level of their gross capital formation has by and large considerably risen due to significant enlargement of the share of domestic savings related to GDP, FDI inflows and workers’ remittances. The author’s calculations show that much faster growth of GDP was achieved in LDCs with moderate level of income inequality and the rising level of the indicator of the rule of law. It would be incorrect to overemphasize the progress made by approximately three dozen LDCs (as the basis of their growth remains shaky), but, nevertheless, they have demonstrated noticeable improvement in dynamics of their investment efficiency and productivity growth.
- Ключевые слова
- least developed countries, inclusive growth, models, total factor productivity, augmented human development index, Gini coefficient, quality of institutions.
- Дата публикации
- 27.08.2018
- Год выхода
- 2018
- Всего подписок
- 12
- Всего просмотров
- 2025
During the last two to three decades a number of developing countries (DCs), including such large ones as the People’s Republic of China and the Republic of India, have succeeded in increasing markedly their rates of economic growth. As a result, by (minimal) criterion, applied by the World Bank and the United Nations1, the share of people living in extreme poverty in the world has contracted more than three times to approximately 1/10. But in the least developed countries (LDCs) this relative indicator has on average declined only by 1/3 to more than 2/5. As for the absolute number of extremely poor in the LDCs, it, on the contrary, grew by 1/5.
If one applies a little bit more rigid criterion of poverty by raising its level by a little over one dollar from 1,9 to $3,2 at 2011 PPPs it is possible to reveal that the level of severe poverty is higher in DCs 2,6 times (nearly 1/3 of the population is afflicted with poverty) and in LDCs - 1,6 times (the respective figure amounts to 3/4 of their population) [1].
Is everything hopeless in the group of LDCs or the waves of positive changes, manifesting much more harmonious and inclusive growth/development, have uplifted them as a number of other DCs (ODCs)?
DYNAMICS OF GROWTH
LDCs is not a tiny group of countries. They represent 1/3 of the total number of DCs (3/5 of African and 1/5 of Asian DCs) and nearly one billion people (13% of the world population). However, their shares in the value of global GDP and exports do not exceed 2 and 1% respectively.
Relative and deep backwardness of many LDCs was brought about by a number of factors, among them - negative consequences of colonialism (which are still having a hefty detrimental impact on many poor countries), substantial dearth of physical and human capital and modern infrastructure, lack of adequate institutions, rational reforms, sound and persistent economic policies, as well as prevalence of rent-seeking activities, pursued primarily by elite groups in many LDCs and frequent waves of political instability.
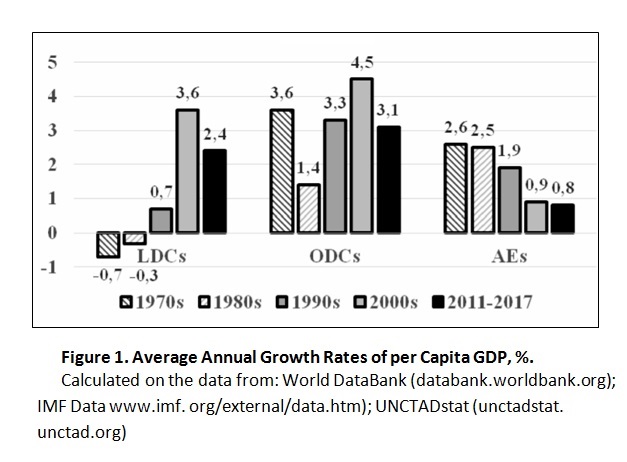
The lagging of LDCs not only behind the advanced economies (AEs), but also behind the ODCs was steadily increasing during a long period of time. In the last three decades of the previous century dynamics of growth of their per capita GDP was substantially lower than on average in ODCs and AEs (see figure 1).
LDCs, ODCs and AEs denote respectively least developed countries, other developing countries and advanced economies. However, in 2000-2017 the average annual growth rate (AAGR) of per capita GDP in LDCs has shot up. The share of LDCs with negative AAGR of the above-mentioned indicator halved from approximately 1/2 in 1970-2000 to 1/4 in 2000-2017. It stemmed from a series of factors, among them - notable amelioration of governance and investment climate in a number of poor countries, an improvement of barter terms of foreign trade (first of all in African LDCs / AFLDCs), as well as a significant rise (primarily in Asian LDCs / ASLDCs) of AAGR of agricultural production and exports of manufactured goods.
At the same time the per capita GDP in LDCs related to the average level of ODCs has fallen from 55% in 1970 to 21% in 2017. It means that despite certain successes achieved by LDCs, the gap between ODCs and them has enlarged in relative dimensions 2,6 times, and in absolute dimensions - 7,7 times (from $1,360 to $10,500 at 2011 PPPs)2.
Since dynamically growing group of ODCs managed to have curtailed its relative gap in per capita GDP with AEs nearly twice - from 5.8 in 1970 to 3.1 times in 2017 (although the absolute gap between them has nearly doubled), it turned out that the relative gap between LDCs and ODCs, measured by GDP per capita, became larger than on the whole between the ODCs and AEs. It means that the character of the processes of divergence and convergence which are underway in the world is rather contradictory, and dangerously explosive potential of disproportions is currently increasing in it, which can result in serious economic, social and political consequences.
MODELS, INGREDIENTS AND FACTORS OF ECONOMIC GROWTH
It is not easy to pin down the exact factors that have recently caused some acceleration in economic growth in nearly three dozen LDCs. However, one may start off with a simple pilot model 1 (see below). Tentative conclusions are as follows. According to our calculations, made on the data of 28 LDCs (which account for more than 90% of their population), comparatively faster per capita GDP growth achieved during 2000-2015 in such countries as Ethiopia, Tanzania, Mozambique, Bangladesh, Lao, Cambodia was due respectively by 1/3 and 1/5 to more rapid growth of agricultural value added and exports, and approximately by ј - to improvement in government effectiveness3.
GDPPERCAPGRi, AGRGRi, EXPGRi, ДGOVEFFi - denote respectively average annual compound growth rates of per capita GDP, agricultural value added, exports of goods and services and improvement in government effectiveness calculated for 28 LDCs with population exceeding 5 million people for which necessary and relatively reliable data was available for 2000-2015. 28 countries are as follows: Afghanistan, Angola, Bangladesh, Benin, Burkina Faso, Burundi, Cambodia, Central African Republic, DR Congo, Eritrea, Ethiopia, Guinea, Laos, Madagascar, Malawi, Mali, Mozambique, Myanmar, Nepal, Rwanda, Senegal, Sierra Leone, Sudan, Togo, Uganda, Tanzania, Yemen, Zambia.
AdjR2 is the adjusted coefficient of determination (varies from 0 to 1, the more - the better) and p is the coefficient of statistical significance (varies from 1 to 0, the less - the better).
Calculated on the data from World DataBank (databank.worldbank.org); IMF Data (www.imf. org/external/data.htm); Worldwide Governance Indicators. (info.worldbank.org/governance)
Elaborating on some of the above-mentioned theses, it is worth being pointed out that more energetic efforts devoted to agricultural development4 in a number of LDCs resulted in a substantial rise of AAGR of their cereal yields: on average from 0,9% in 1980-2000 to 1,4% in 20002016. Yields increased from 13,3 metric centners per hectare in 1980 to 16 in 2000 and 20 in 20165. However, the gap remains huge, not only compared to, e.g., the USA (81 metric centners per hectare) and the People’s Republic of China (60), but also to Indonesia (54) and India (30). Although AAGR of Total Factor Productivity (TFP) in LDCs’ agriculture has grown 2,5 times - from 0,6% in 1980-2000 to 1,5% in 2000-2015 (reaching on average 1,3% in AFLDCs and 2,7% in ASLDCs), the gap in agricultural labor productivity between ODCs and LDCs in 1980-2016 rose from twofold to threefold [2].
Nearly twofold acceleration of average rates of economic growth in LDCs (on the whole from 2,8% in 1980-2000 to 5,5% in 2000-2017) was also brought about by tripling of AAGR of their manufacturing production (to 7,5%) and doubling of AAGR of physical volume of exports (to 8,5%). However, there are many parameters revealing serious economic vulnerability of the LDCs: (a) their manufacturing value added share in GDP (11%; 16% in ASLDCs, 8% in AFLDCs) is 1,8 times less than on average that for the ODCs; (b) coefficient of concentration of exports during the last two decades has grown from 0,21 to 0.24, having surpassed that of ODCs by 2,7 and that of AEs by 3,5 times; (c) the share of hightech exports in LDCs’ exports is nowadays (less than 1%) nearly 15 times less than on average in ODCs.
Despite the fact that LDCs’ share of domestic savings in GDP has nearly doubled (from 8,5% in 1981-2000 to 16% in 2001-2017), their level of gross fixed capital formation related to GDP, which has augmented from 16 to 23%, is still substantially (by Ѕ in 1981-2000 and 1/3 in 2001-2017) fueled by external financial sources (in 2001-2017 Net Official Development Assistance and net inflows of FDI account on average for 5 and 2% of GDP respectively). As for financial depth of LDCs’ economy, which is one of the most important drivers of the modern economy, it remains very low. Although such indicator as domestic credit to private sector has on average more than doubled from 12,2% in 2000 to 27.5% in 2016, it is 3,5 times less than that for ODCs and 5,4 than in AEs.
Because of the dearth of reliable information much remains to be done in investigating very important issues dealing with research on efficient governance. However, available data on five relatively large LDCs, which total half of their population, reveals that these countries have started to pursue more or less sound economic policies. In 1980-2018 indices of economic freedom6 rose in Bangladesh, Myanmar (Burma) and Ethiopia from 27-32 to 53-55, in DR Congo - from 23 to 52 and in Tanzania - from 36 to 60. According to the available data, in 2002-2018 time required for starting a business contracted in Bangladesh from 30 to 20 days, in Ethiopia - from 44 to 33, in Uganda - from 36 to 24, in Tanzania - from 37 to 28, in Mozambique from 214 to 19 and in Madagascar - from 68 to 8 days [3]. These and some other changes in investment climate and a negligible group of LDCs seem to have brought some valuable results.
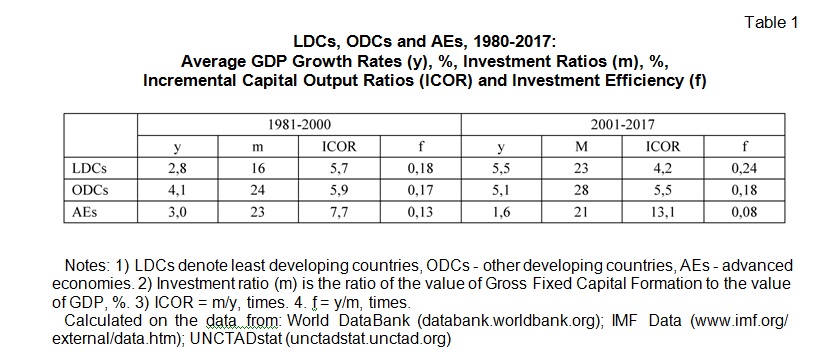
If investment ratio in ODCs rose on average by 4 percentage points from 24 % of GDP in 1980-2000 to 28% in 2001-2017, or by 1/6, in LDCs this indicator increased by 7 p.p., or by 2/5 (see table 1). Compared to ODCs and AEs, LDCs’ incremental capital output ratio economic policies of not (ICOR) has on average decreased substantially. And acceleration of LDCs’ economic growth was by more than 2/5 caused by the improvement of investment efficiency (in ODCs only by 1/4)7.
It is, however, useful to make one correction. Given that, according to estimates, the investment ratio, measured in PPPs (or, so to say, in real terms) is on average in ODCs and LDCs less than that in nominal terms approximately by 1/10 and 1/4 respectively [4], the latter (LDCs), first, are still lagging behind the former more significantly (not by 5 p.p., but by 8 p.p.). It implies, that if LDCs really want to embark on modern and steady economic growth, their productive capacities should be much more substantially enlarged by means of increasing physical (and, of course, human) capital investment ratios. Second, and that is more flattering to LDCs, the above-mentioned correction allows to say that, compared to ODCs, LDCs’ investment efficiency in 2000-2017 turned to be higher than on average in ODCs not by 1/3, but by 3/5 (although that, to some extent, stemmed from the comparative advantage of ‘low start level’). In other words, the ‘price’ of their economic growth, i.e. ICOR (calculated either in nominal or real terms), is currently one of the cheapest in the world (compared to ODCs and AEs), which can invigorate capital formation and attract increasing amounts of domestic and foreign direct investment to the real sector of their economies.
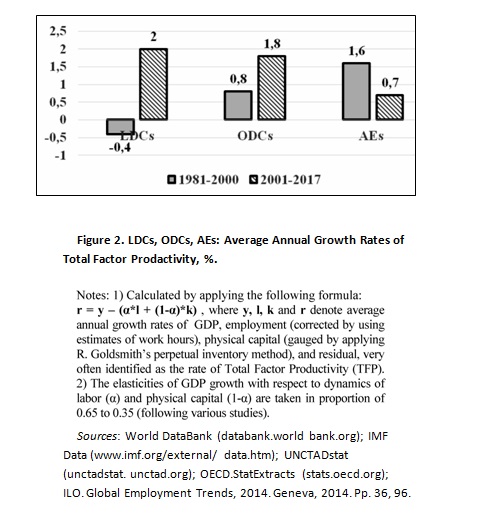
Although acceleration of the AAGR of GDP during the first 17 years of the current century in ODCs as well as in LDCs was primarily caused by the increase in their AAGR of TFP (see figure 2), in the latter group this acceleration was nearly three times higher (see figure 1) than in the former and accompanied by substantial upsurge in the contribution of TFP to GDP growth (in the group of LDCs from approximately (-)1/7 to more than 1/3 and in ODCs - from 1/5 to 1/3).
However, despite the fact, that during the first 17 years of the current century ODCs and LDCs have been surpassing AEs by rates of TFP growth nearly three times, on the whole during 1980-2017 the level of TFP in ODCs related to AEs has risen only from 35 to 38% and that of LDCs has actually decreased from 22 to 18% (see figure 3).
It is worth being emphasized that the basis for sustained economic growth in LDCs is so far very shaky. On average the deficit of their current account balance has risen fourfold from the period of 20062008 to 2015-2017 and reached 3 to 4% of their GDP. As for AAGR of LDCs’ per capita GDP, it has contracted nearly twice from 4,9% in 2005-2010 to 2.6% in 2012-2017.
ECOLOGICAL AND SOCIAL REPERCUSSIONS AND FACTORS OF ECONOMIC GROWTH
Some improvements in long-term dynamics of LDCs’ economic growth are, unfortunately, as in many other poor countries accompanied by a nonnegligible deterioration of their environmental sustainability. For instance, according to available data, in 1990-2013 forest area was contracting by 0,5% per annum or 2,5 times faster than on average in ODCs. Meanwhile carbon dioxide emissions per capita (although from comparatively low level) was increasing (2,1% per annum) three times faster than in ODCs (0,7%). As for the ratio of natural resource depletion, which in LDCs in 2010-2015 amounted to 8,6% of their Gross National Product, it surpassed the respective figure for ODC 2.5, and for AEs - 17 times [5]. So, it is not ruled out that LDCs’ adjusted GDP per capita has been expanding recently somewhat slower than per capita GDP.
On a number of characteristics of human development LDCs on the whole have gradually started to catch up with ODCs. In 1980-2017 the indicator of life expectancy at birth has risen from 48 to 65 and from 62 to 72 years, and that of average years of educational attainment has augmented from 1,6 to 4,3 and from 4,5 to 7,2 respectively. However, the share of the adult population in LDCs which hold higher education degrees (3 to 4%) is less approximately three times than on average in ODCs and ten times than in AEs. By a number of patent applications filed per one million people the gap between ODCs and LDCs in 1990-2016 has soared 20 times and it is on average 30 times greater than between the former and the AEs.
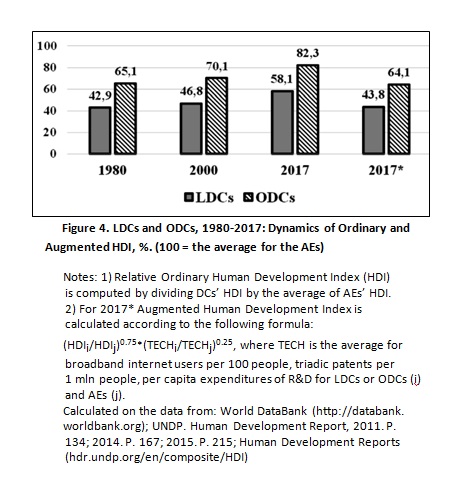
By Ordinary Human Development Index (OHDI), LDCs during the last 3 to 4 decades were on average progressing (although from a very low start) twice faster than on average ODCs and three times as fast as AEs. And therefore, some non-negligible convergence is beyond any doubt underway: in 19802017 ODCs’ Relative OHDI has grown by ј and that of LDCs by more than 1/3 (see figure 4).
However, according to Augmented Human Development Index (enlarged by inclusion of index of technological development) ODCs on the whole do not amount to 2/3 and LDCs’ level related to AEs is only slightly higher than 2/5. The share of population in LDCs living in the middle of 2010s in multidimensional poverty (on average 2/3) was 2,5 times higher than on the whole in ODCs (1/4), ranging from 41 and 59% in Bangladesh and Afghanistan respectively to 66% in Tanzania, 72,5% in Congo Dem. Rep., 76,3% in Central African Republic and 88% in Ethiopia8.
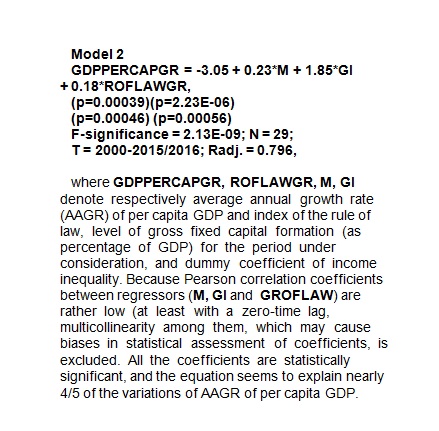
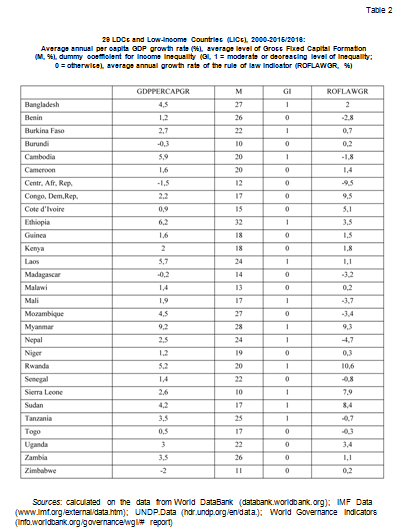
For a long period of time, scholars and policymakers were searching for developmental factors that are characterized by synergetic effects, capable to solve simultaneously economic, social and political problems, tormenting the poor countries.In order to sort out the impact of some of the social and institutional factors that shape economic growth of LDCs I have constructed the following model 2 (see below), taking into account countries where population by the middle of 2010s exceeded 5 mln and for whom I was able to find more or less reliable data. However, I am not very much happy with the accuracy of data on levels and dynamics of income distribution, for which, therefore, the dummies were applied: ‘1’ if Gini coefficient is moderate (does not surpass 0.4) or decreasing; ‘0’ - otherwise.
My calculations (based on the data from table 2) seem to demonstrate, that in 2000-2015/2016 difference in average annual growth rates of per capita GDP of 7 more dynamic LDCs (Ethiopia, Myanmar, Laos, Cambodia, Rwanda, Bangladesh, Mozambique) and 7 less dynamic countries (Zimbabwe, Central African Republic, Burundi, Madagascar, Benin, Togo, Cфte d’Ivoire),which on average amounted to 6,1 p.p., stemmed approximately by 2/5 by higher level of fixed capital formation in GDP in the first group, by 1/4 - by lower or decreasing levels of income inequality in them9 and by more than 1/10 by improving levels of the rule of law (1/4 of the variance in AAGR of per capita GDP is due to not identified factors).
It should be underscored that, although such an important factor as the investment ratio (on average, 25% for the superachievers and only 15% for underachievers among 29 countries of our group) accounts for approximately a half of the impact of the identified determinants of LDCs’ and LICs’ per capita dynamics, the other half is explained by social and institutional factors, which may indicate that socially and institutionally inclusive policies, which are, beyond any doubt, very important for the poor and less well-to-do in LDCs and LICs in general can be by themselves important engines of vigorous and sustainable economic growth. They enhance social, as well as human capital, and enlarge markets.
It seems realistic to suggest, that without energetic efforts directed to reforming LDCs’ basic institutions it will be very difficult for them to withstand technological and other challenges of quickly changing world, in which economic and geopolitical competition is gathering momentum. Meanwhile, according to available data, during 2006-2017 approximately 2/5 of the LDCs have experienced substantial rise on Fragile States Index and only in 1/5 of them this index has significantly the level of quality of institutions they are still hugely fallen. If by the level of per capita GDP LDCs have (in 1996-2016 two times) lagging behind ODCs, and from the beginning of the century started to make the latter group, in its turn, nearly by the same factor some steps on the road of catch-up development, by is lagging behind the advanced economies [6].
